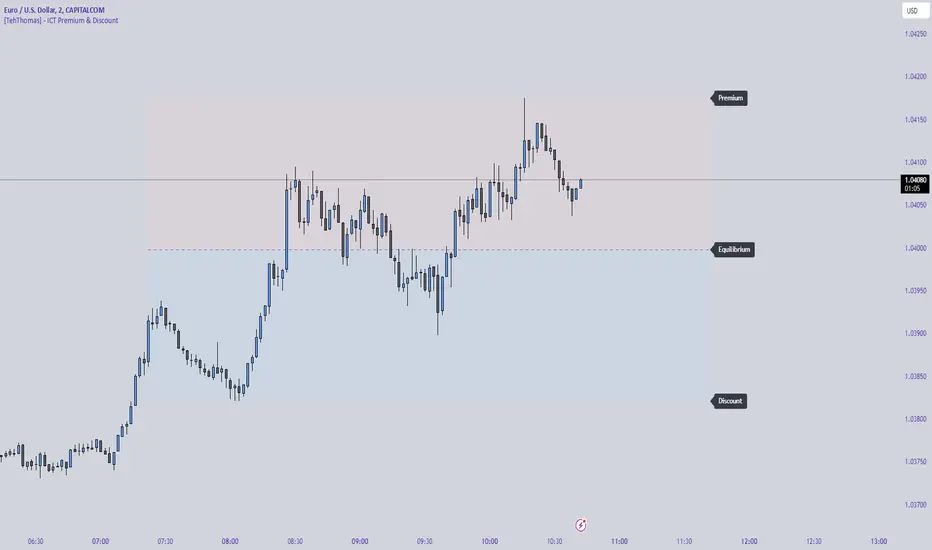
[TehThomas] - ICT Premium & Discount - ICT Premium & Discount: Script Overview
This TradingView script is designed to visualize the ICT (Inner Circle Trader) Premium & Discount Concept by dynamically identifying the key price zones within a specified lookback period. It highlights the Premium Zone, Discount Zone, and Equilibrium Level, helping traders assess where price is trading in relation to historical highs and lows.
How the Script Works
1. Lookback Period Calculation
The script scans the last X bars (user-defined lookback period) to find the highest high and lowest low during that time.
This helps establish a reference range for determining whether the current price is trading in a premium (overbought) or discount (oversold) area.
2. Equilibrium Level
The equilibrium is simply the midpoint between the highest high and the lowest low within the lookback period.
This level serves as a fair value price where price often reacts or consolidates.
3. Drawing the Premium & Discount Zones
The script creates two distinct zones:
Premium Zone (above equilibrium): Price is considered expensive.
Discount Zone (below equilibrium): Price is considered cheap.
These zones are displayed using colored boxes (red for premium, green for discount).
4. Equilibrium Line & Labels
A dashed equilibrium line is plotted at the midpoint to give a visual reference.
Labels for Premium, Discount, and Equilibrium are added to help traders quickly identify these levels.
Settings You Can Change
The script includes multiple input parameters that allow customization:
1. Lookback Period (lookback)
Default: 50 bars
Defines how many past candles to analyze for the highest high and lowest low.
A larger lookback provides a broader market structure, while a smaller one captures short-term moves.
Premium Zone Color (premium_color)
Default: Red (80% transparency)
You can modify this to change how the premium zone appears on the chart.
Discount Zone Color (discount_color)
Default: Green (80% transparency)
Allows customization of the discount zone’s color.
Extend Boxes Right (extend_right)
Default: 15 bars
Defines how far the premium and discount boxes extend into the future for better visibility.
Why This Script is Useful
Identifies High-Probability Trade Zones.
Traders can use the Premium & Discount zones to find optimal trade entries based on ICT concepts.
Buy in the Discount Zone and sell in the Premium Zone when confluence aligns.
Enhances Smart Money Concepts (SMC) Trading
ICT traders look for liquidity sweeps, fair value gaps, and order blocks.
Combining these with premium & discount levels increases trade accuracy.
Works on Any Timeframe & Asset
The script is effective across forex, crypto, stocks, and indices on multiple timeframes.
How to Use the ICT Premium & Discount Concept in Trading
Find the Range
Apply the script to your chart and check the premium and discount levels.
Ensure you are using a relevant lookback period (e.g., 50 bars for intraday, 100+ for higher timeframes).
Wait for Price to Enter a Key Zone
Long Trades: Look for bullish confirmations (e.g., liquidity grabs, order blocks) in the Discount Zone.
Short Trades: Seek bearish setups in the Premium Zone where price is expensive.
Use the Equilibrium as a Reaction Zone
Price often bounces off or retests equilibrium before making a directional move.
Consider it as a dynamic support/resistance level.
Combine with Other ICT Concepts
Fair Value Gaps (FVGs): Look for price inefficiencies inside premium/discount zones.
Liquidity Sweeps: Watch for stop hunts and false breakouts before entering trades.
Order Blocks (OBs): Use smart money footprints to refine your entries.
Final Thoughts
This script is a powerful tool for ICT traders looking to refine their premium & discount analysis. By visually separating the market into premium (overbought) and discount (oversold) zones, traders can make more informed, high-probability trading decisions.
Cari dalam skrip untuk "Inner circle trader "
True Liquidity BlocksSo basically I've been deep diving into liquidity trading concepts similar to ICT (Inner Circle Trader) and developed an indicator that breaks down market movement through a volume-centric lens.
Key Concept:
Markets move not just by price, but by resolving trapped positions
Volume segments, not time intervals, show true market dynamics
VWAP (Volume Weighted Average Price) becomes a key structural reference
What Makes This Different:
Tracks volume segments instead of fixed time frames
Identifies "trapped" trader positions
Measures liquidity level efficiency
Color-codes bars based on nearest liquidity zone
Indicator Features:
Cyan/Red liquidity levels showing buy/sell pressure
Efficiency tracking for each level
Dynamic volume-based segmentation
Bar coloring to show nearest liquidity zone
Theoretical Inspiration: Viewed markets as energy systems where:
Positions create potential energy
Price movement resolves this energy
Trends form through systematic position liquidation
VWAP Recalculation in Each Segment:
Segment Start:
VWAP resets when volume threshold User Inputtable (600,000) is reached
Uses the last 4 price values (High, Low, Close, Close) for calculation
Weighted by volume traded during that segment
Calculation Method:
pineCopy = ta.vwap(hlcc4, na(segment_start) ? true : na, 1)
hlcc4: Combines high, low, close prices
na(segment_start): Ensures reset at new segment
Weighted by volume, not equal time intervals
Key Points:
Dynamic recalculation each segment
Reflects most recent trading activity
Provides real-time fair price reference
Tracks positioning
Essentially, VWAP resets and recalculates with each new volume segment, creating a rolling, volume-weighted average price that maps trader positioning.
BSL (Buy Side Liquidity) and SSL (Sell Side Liquidity) Explained:
When a volume segment closes relative to VWAP, it creates natural positioning traps:
BSL (Cyan) - Created when price closes BELOW THAT SEGMENT'S VWAP:
Bulls are positioned BELOW VWAP (trapped)
Shorts are positioned ABOVE VWAP (In Profit)
SSL (Red) - Created when price closes ABOVE THAT SEGMENT"S VWAP:
Bulls are positioned ABOVE VWAP (trapped)
Shorts are positioned BELOW VWAP (trapped)
Core Mechanism:
VWAP acts as a reference point for trader positioning
Trapped positions create inherent market tension
Levels expand to show accumulating pressure
Color-coded for quick identification of potential move direction
The goal: Visualize where traders are likely "stuck" and must eventually resolve their positions or liquidate other's, driving market movement.
It was just a fun experiment but If ya'll have any thoughts on it or what I could do to improve it, I would appreciate it.
Just a little note, It's optimized for futures, but if u uncheck the "Rest at Futures Open ?" setting, it allow full reign of any asset with volume data.

Twitter Model ICT [TradingFinder] MMXM ERL D + FVG + M15 MSS/SMT🔵 Introduction
The Twitter Model ICT is a trading approach based on ICT (Inner Circle Trader) models, focusing on price movement between external and internal liquidity in lower timeframes. This model integrates key concepts such as Market Structure Shift (MSS), Smart Money Technique (SMT) divergence, and CISD level break to identify precise entry points in the market.
The primary goal of this model is to determine key liquidity levels, such as the previous day’s high and low (PDH/PDL) and align them with the Fair Value Gap (FVG) in the 1-hour timeframe. The overall strategy involves framing trades around the 1H FVG and using the M15 Market Structure Shift (MSS) for entry confirmation.
The Twitter Model ICT is designed to utilize external liquidity levels, such as PDH/PDL, as key entry zones. The model identifies FVG in the 1-hour timeframe, which acts as a magnet for price movement. Additionally, traders confirm entries using M15 Market Structure Shift (MSS) and SMT divergence.
Bullish Twitter Model :
In a bullish setup, the price sweeps the previous day’s low (PDL), and after confirming reversal signals, buys are executed in internal liquidity zones. Conversely, in a bearish setup, the price sweeps the previous day’s high (PDH), and after confirming weakness signals, sells are executed.
Bearish Twitter Model :
In short setups, entries are only executed above the Midnight Open, while in long setups, entries are taken below the Midnight Open. Adhering to these principles allows traders to define precise entry and exit points and analyze price movement with greater accuracy based on liquidity and market structure.
🔵 How to Use
The Twitter Model ICT is a liquidity-based trading strategy that analyzes price movements relative to the previous day’s high and low (PDH/PDL) and Fair Value Gap (FVG). This model is applicable in both bullish and bearish directions and utilizes the 1-hour (1H) and 15-minute (M15) timeframes for entry confirmation.
The price first sweeps an external liquidity level (PDH or PDL) and then provides an entry opportunity based on Market Structure Shift (MSS) and SMT divergence. Additionally, the entry should be positioned relative to the Midnight Open, meaning long entries should occur below the Midnight Open and short entries above it.
🟣 Bullish Twitter Model
In a bullish setup, the price first sweeps the previous day’s low (PDL) and reaches an external liquidity level. Then, in the 1-hour timeframe (1H), a bullish Fair Value Gap (FVG) forms, which serves as the price target.
To confirm the entry, a Market Structure Shift (MSS) in the 15-minute timeframe (M15) should be observed, signaling a trend reversal to the upside. Additionally, SMT divergence with correlated assets can indicate weakness in selling pressure.
Under these conditions, a long position is taken below the Midnight Open, with a stop-loss placed at the lowest point of the recent bearish move. The price target for this trade is the FVG in the 1-hour timeframe.
🟣 Bearish Twitter Model
In a bearish setup, the price first sweeps the previous day’s high (PDH) and reaches an external liquidity level. Then, in the 1-hour timeframe (1H), a bearish Fair Value Gap (FVG) is identified, serving as the trade target.
To confirm entry, a Market Structure Shift (MSS) in the 15-minute timeframe (M15) should form, signaling a trend shift to the downside. If an SMT divergence is present, it can provide additional confirmation for the trade.
Once these conditions are met, a short position is taken above the Midnight Open, with a stop-loss placed at the highest level of the recent bullish move. The trade's price target is the FVG in the 1-hour timeframe.
🔵 Settings
Bar Back Check : Determining the return of candles to identify the CISD level.
CISD Level Validity : CISD level validity period based on the number of candles.
Daily Position : Determines whether only the first signal of the day is considered or if signals are evaluated throughout the entire day.
Session : Specifies in which trading sessions the indicator will be active.
Second Symbol : This setting allows you to select another asset for comparison with the primary asset. By default, "XAUUSD" (Gold) is set as the second symbol, but you can change it to any currency pair, stock, or cryptocurrency. For example, you can choose currency pairs like EUR/USD or GBP/USD to identify divergences between these two assets.
Divergence Fractal Periods : This parameter defines the number of past candles to consider when identifying divergences. The default value is 2, but you can change it to suit your preferences. This setting allows you to detect divergences more accurately by selecting a greater number of candles.
The indicator allows displaying sessions based on various time zones. The user can select one of the following options :
UTC (Coordinated Universal Time)
Local Time of the Session
User’s Local Time
Show Open Price : Displays the New York market opening price.
Show PDH / PDL : Displays the previous day’s high and low to identify potential entry points.
Show SMT Divergence : Displays lines and labels for bullish ("+SMT") and bearish ("-SMT") divergences.
🔵 Conclusion
The Twitter Model ICT is an effective approach for analyzing and executing trades in financial markets, utilizing a combination of liquidity principles, market structure, and SMT confirmations to identify optimal entry and exit points.
By analyzing the previous day’s high and low (PDH/PDL), Fair Value Gaps (FVG), and Market Structure Shift (MSS) in the 1H and M15 timeframes, traders can pinpoint liquidity-driven trade opportunities. Additionally, considering the Midnight Open level helps traders avoid random entries and ensures better trade placement.
By applying this model, traders can interpret market movements based on liquidity flow and structural changes, allowing them to fine-tune their trading decisions with higher precision. Ultimately, the Twitter Model ICT provides a structured and logical approach for traders who seek to trade based on liquidity behavior and trend shifts in the market.

ICT Killzones + Macros [TakingProphets]The ICT Killzones indicator is a powerful tool designed to visualize key trading sessions and market timing elements used in ICT (Inner Circle Trader) methodology. It includes:
• Session Markers:
- Asia Session
- London Session
- NY AM Session
- NY Lunch Session
- NY PM Session
• Key Price Levels:
- Session high/low levels that extend until violated
- Midnight Open price level (dotted line)
- True Day Open price level (6 PM EST, dotted line)
• ICT Macro Timing:
- First Macro: 9:45 AM - 10:15 AM EST
- Second Macro: 10:45 AM - 11:15 AM EST
- Distinctive L-shaped brackets marking start and end times
Features:
• Fully customizable colors and styles for all elements
• Adjustable label positions and sizes
• Toggle options for each component
• Smart timeframe filtering
• Clean, uncluttered visual design
This indicator helps traders identify key market structure points, session transitions, and optimal trading windows based on ICT concepts.

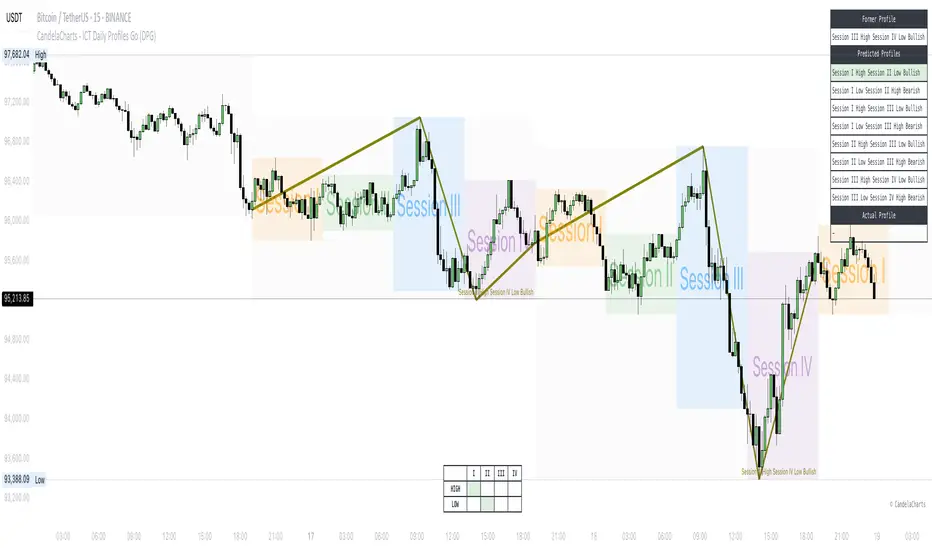
CandelaCharts - ICT Daily Profiles Go (DPG)📝 Overview
The ICT Daily Profiles by CandelaCharts, inspired by ICT teachings, offer a pattern-driven approach to trading by identifying and analyzing the key highs and lows of intraday sessions.
This toolkit automatically highlights these ICT Daily Profiles on your charts, allowing traders to efficiently identify critical zones for analysis and informed decision-making.
Whether you're an experienced trader or just starting out, ICT Daily Profiles deliver actionable frameworks to deepen your understanding of price behavior and enhance your intraday trading performance.
📦 Features
The ICT Daily Profiles toolkit provides a robust suite of features tailored to improve trading accuracy and support informed decision-making. Its key highlights include:
Daily Profiles
Advanced Styling
Scanner
The indicator supports the following profiles:
Session I High Session II Low Bearish
Session I High Session III Low Bearish
Session II High Session III Low Bearish
Session III High Session IV Low Bearish
Session I Low Session II High Bullish
Session I Low Session III High Bullish
Session II Low Session III High Bullish
Session III Low Session IV High Bullish
⚙️ Settings
Sessions: Controls how many sessions you want to see.
History: Controls how many profiles are displayed on the chart.
Timeframe Limit: Sets the timeframe up to which profiles will be drawn.
Show OHLC Lines: Display the lines for OHLC.
Show Profile Line: Display the Daily Profile line.
Use NY Midnight Open: Controls from where a profile will start detection.
Open: Style for Open line.
High: Style for High line.
Low: Style for Low line.
Midline: Style for Profile Midline.
Label: Controls the position of the Daily Profile name.
Scanner: Display the Scanner
⚡️ Showcase
ICT (Inner Circle Trader) daily profile templates are analytical models that classify and outline common price action patterns observed throughout a trading day.
ICT Daily Profiles
Scanner
📒 Usage
The ICT Daily Profiles indicator aims to give traders a clear and actionable view of the Daily Previous, Current, and Future Profiles. This enables them to analyze market structure, predict price movements, and align their trading strategies with higher time-frame trends.
Load the indicator on the chart
Enable Scanner
See the Predicted Profiles list
Predicted Profiles represent all potential scenarios for the current day, generated by a profile detection algorithm.
By visualizing potential outcomes through Predicted Profiles, the ICT Daily Profiles indicator provides traders with a strategic edge, allowing them to remain flexible, prepared, and aligned with the most probable market movements.
🚨 Alerts
The indicator does not provide any alerts!
🔹 Notes
ICT Daily Profiles
pbs.twimg.com
⚠️ Disclaimer
Trading involves significant risk, and many participants may incur losses. The content on this site is not intended as financial advice and should not be interpreted as such. Decisions to buy, sell, hold, or trade securities, commodities, or other financial instruments carry inherent risks and are best made with guidance from qualified financial professionals. Past performance is not indicative of future results.
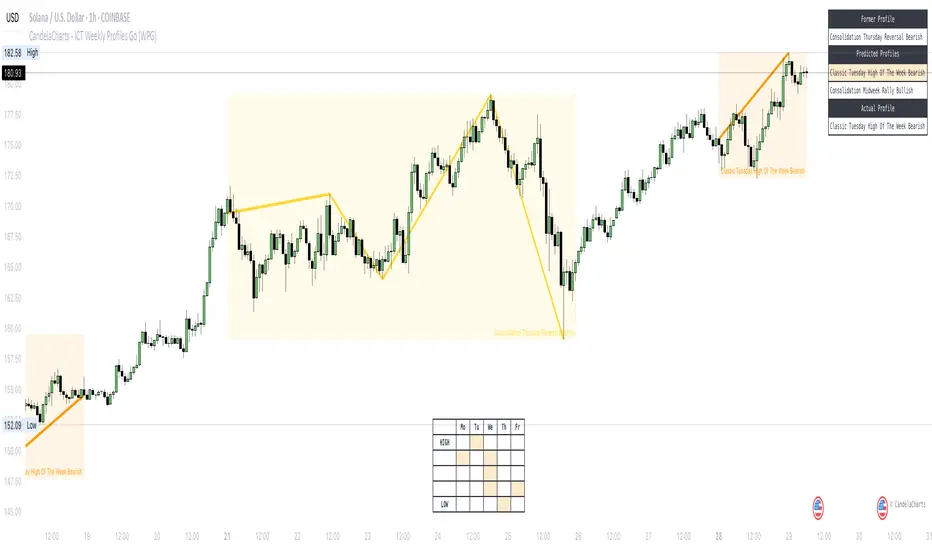
CandelaCharts - ICT Weekly Profiles Go (WPG) 📝 Overview
The indicator provides a pattern-based approach to the ICT Weekly Profiles, emphasizing a line that marks the Open, High, Low, and Close of the week. This line allows you to instantly visualize and identify the Weekly Profile.
ICT Weekly Profiles are structured conceptual frameworks designed to outline typical patterns of price behavior over the course of a trading week. These profiles serve as analytical tools, offering traders insights into recurring market tendencies and helping them identify potential opportunities and risks.
The toolkit automatically detects and marks these Weekly Profiles on the chart, enabling traders to quickly pinpoint critical zones for analysis and decision-making.
📦 Features
The Block Concepts toolkit offers a comprehensive set of features designed to enhance trading precision and decision-making. Key features include:
Weekly Profiles (8)
Advanced Styling
Scanner
The indicator supports the following profiles:
ICT Weekly Profiles
Classic Tuesday Low Of The Week Bullish
Classic Tuesday High Of The Week Bearish
Wednesday Low Of The Week Bullish
Wednesday High Of The Week Bearish
Consolidation Thursday Reversal Bullish
Consolidation Thursday Reversal Bearish
Consolidation Midweek Rally Bullish
Consolidation Midweek Rally Bearish
⚙️ Settings
History: Controls how many profiles are displayed on the chart.
Timeframe Limit: Sets the timeframe up to which profiles will be drawn.
Show OHLC Lines: Display the lines for OHLC.
Show Profile Line: Display the Weekly Profile line.
Use NY Midnight Open: Controls from where a profile will start detection.
Open: Style for Open line.
High: Style for High line.
Low: Style for Low line.
Midline: Style for Profile Midline.
Label: Controls the position of the Weekly Profile name.
Scanner: Display the Scanner
⚡️ Showcase
ICT (Inner Circle Trader) weekly profile templates are analytical frameworks that categorize and describe typical patterns of price action observed during a trading week.
ICT Weekly Profiles
Scanner
📒 Usage
The primary objective of the ICT Weekly Profiles indicator is to provide traders with a comprehensive and actionable overview of the Weekly Previous, Current, and Future Profile. This allows traders to interpret market structure, anticipate price behavior, and align their trading decisions with higher time-frame trends.
Load the indicator on the chart
Enable Scanner
See the Predicted Profiles list
Predicted Profiles represent all potential scenarios for the current week, generated by a profile detection algorithm.
By visualizing potential outcomes through Predicted Profiles, the ICT Weekly Profiles indicator provides traders with a strategic edge, allowing them to remain flexible, prepared, and aligned with the most probable market movements.
🚨 Alerts
The indicator does not provide any alerts!
🔹 Notes
ICT Weekly Profiles
pbs.twimg.com
⚠️ Disclaimer
Trading involves significant risk, and many participants may incur losses. The content on this site is not intended as financial advice and should not be interpreted as such. Decisions to buy, sell, hold, or trade securities, commodities, or other financial instruments carry inherent risks and are best made with guidance from qualified financial professionals. Past performance is not indicative of future results.
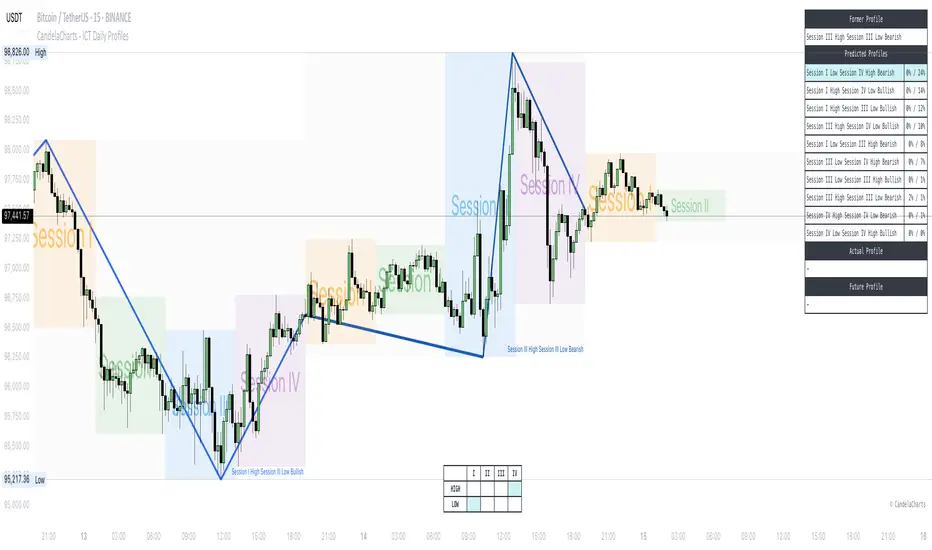
CandelaCharts - ICT Daily Profiles📝 Overview
The ICT Daily Profiles by CandelaCharts rooted in the ICT teachings represent a pattern-based approach to trading that focuses on identifying and analyzing the key highs and lows of various intraday trading sessions.
The toolkit automatically detects and marks these ICT Daily Profiles on the chart, enabling traders to quickly pinpoint critical zones for analysis and decision-making.
Whether you are a seasoned professional or a developing trader, ICT Daily Profiles provides actionable frameworks to enhance your understanding of price dynamics and improve your intraday trading performance.
📦 Features
The ICT Daily Profiles toolkit offers a comprehensive set of features designed to enhance trading precision and decision-making. Key features include:
Daily Profiles
Advanced Styling
Scanner
The indicator supports the following profiles:
Session I High Session II Low Bearish
Session I High Session III Low Bearish
Session I High Session IV Low Bearish
Session II High Session III Low Bearish
Session II High Session IV Low Bearish
Session III High Session IV Low Bearish
Session I Low Session II High Bullish
Session I Low Session III High Bullish
Session I Low Session IV High Bullish
Session II Low Session III High Bullish
Session II Low Session IV High Bullish
Session III Low Session IV High Bullish
Session I High Session I Low Bearish
Session I Low Session I High Bearish
Session II High Session II Low Bearish
Session II Low Session II High Bearish
Session III High Session III Low Bearish
Session III Low Session III High Bearish
Session IV High Session IV Low Bearish
Session IV Low Session IV High Bearish
⚙️ Settings
Sessions: Controls how many sessions you want to see.
History: Controls how many profiles are displayed on the chart.
Timeframe Limit: Sets the timeframe up to which profiles will be drawn.
Show OHLC Lines: Display the lines for OHLC.
Show Profile Line: Display the Daily Profile line.
Use NY Midnight Open: Controls from where a profile will start detection.
Open: Style for Open line.
High: Style for High line.
Low: Style for Low line.
Midline: Style for Profile Midline.
Label: Controls the position of the Daily Profile name.
Scanner: Display the Scanner
⚡️ Showcase
ICT (Inner Circle Trader) daily profile templates are analytical frameworks that categorize and describe typical patterns of price action observed during a trading day.
ICT Daily Profiles
Scanner
📒 Usage
The ICT Daily Profiles indicator aims to give traders a clear and actionable view of the Daily Previous, Current, and Future Profiles. This enables them to analyze market structure, predict price movements, and align their trading strategies with higher time-frame trends.
Load the indicator on the chart
Enable Scanner
See the Predicted Profiles list
Predicted Profiles represent all potential scenarios for the current day, generated by a profile detection algorithm.
By visualizing potential outcomes through Predicted Profiles, the ICT Daily Profiles indicator provides traders with a strategic edge, allowing them to remain flexible, prepared, and aligned with the most probable market movements.
🚨 Alerts
The indicator does not provide any alerts!
🔹 Notes
ICT Daily Profiles
pbs.twimg.com
⚠️ Disclaimer
These tools are exclusively available on the TradingView platform.
Our charting tools are intended solely for informational and educational purposes and should not be regarded as financial, investment, or trading advice. They are not designed to predict market movements or offer specific recommendations. Users should be aware that past performance is not indicative of future results and should not rely on these tools for financial decisions. By using these charting tools, the purchaser agrees that the seller and creator hold no responsibility for any decisions made based on information provided by the tools. The purchaser assumes full responsibility and liability for any actions taken and their consequences, including potential financial losses or investment outcomes that may result from the use of these products.
By purchasing, the customer acknowledges and accepts that neither the seller nor the creator is liable for any undesired outcomes stemming from the development, sale, or use of these products. Additionally, the purchaser agrees to indemnify the seller from any liability. If invited through the Friends and Family Program, the purchaser understands that any provided discount code applies only to the initial purchase of Candela's subscription. The purchaser is responsible for canceling or requesting cancellation of their subscription if they choose not to continue at the full retail price. In the event the purchaser no longer wishes to use the products, they must unsubscribe from the membership service, if applicable.
We do not offer reimbursements, refunds, or chargebacks. Once these Terms are accepted at the time of purchase, no reimbursements, refunds, or chargebacks will be issued under any circumstances.
By continuing to use these charting tools, the user confirms their understanding and acceptance of these Terms as outlined in this disclaimer.
CandelaCharts - ICT Weekly Profiles📝 Overview
The indicator provides a pattern-based approach to the ICT Weekly Profiles, emphasizing a line that marks the Open, High, Low, and Close of the week. This line allows you to instantly visualize and identify the Weekly Profile.
The profile detection relies on the week’s high and low, delivering a clear and concise representation of the weekly profile.
ICT Weekly Profiles are structured conceptual frameworks designed to outline typical patterns of price behavior over the course of a trading week. These profiles serve as analytical tools, offering traders insights into recurring market tendencies and helping them identify potential opportunities and risks.
The ICT Weekly Profiles indicator offers two distinct types of profiles to provide a clearer understanding of weekly price action:
ICT Weekly Profiles
ICT Missing Weekly Profiles
The toolkit automatically detects and marks these ICT Weekly Profiles and ICT Missing Weekly Profiles on the chart, enabling traders to quickly pinpoint critical zones for analysis and decision-making.
📦 Features
The ICT Weekly Profiles toolkit offers a comprehensive set of features designed to enhance trading precision and decision-making. Key features include:
Weekly Profiles
Missing Weekly Profiles
Advanced Styling
Scanner
The indicator supports the following profiles:
ICT Weekly Profiles
Classic Tuesday Low Of The Week Bullish
Classic Tuesday High Of The Week Bearish
Wednesday Low Of The Week Bullish
Wednesday High Of The Week Bearish
Consolidation Thursday Reversal Bullish
Consolidation Thursday Reversal Bearish
Consolidation Midweek Rally Bullish
Consolidation Midweek Rally Bearish
Wednesday Weekly Reversal Bullish
Wednesday Weekly Reversal Bearish
Seek And Destroy Bullish Friday
Seek And Destroy Bearish Friday
ICT Missing Weekly Profiles
Monday Low Tuesday High Bullish
Monday High Tuesday Low Bearish
Monday Low Wednesday High Bullish
Monday High Wednesday Low Bearish
Monday Low Thursday High Bullish
Monday High Thursday Low Bearish
Tuesday Low Wednesday High Bullish
Tuesday High Wednesday Low Bearish
Tuesday Low Friday High Bullish
Tuesday High Friday Low Bearish
Wednesday Low Thursday High Bullish
Wednesday High Thursday Low Bearish
Monday Low Friday High Bullish
Monday Friday Bearish Rally
Monday High/Low Range
Tuesday High/Low Range
Wednesday High/Low Range
Thursday High/Low Range
Friday High/Low Range
⚙️ Settings
History: Controls how many profiles are displayed on the chart.
Timeframe Limit: Sets the timeframe up to which profiles will be drawn.
Show OHLC Lines: Display the lines for OHLC.
Show Profile Line: Display the Weekly Profile line.
Use NY Midnight Open: Controls from where a profile will start detection.
Open: Style for Open line.
High: Style for High line.
Low: Style for Low line.
Midline: Style for Profile Midline.
Label: Controls the position of the Weekly Profile name.
Scanner: Display the Scanner
⚡️ Showcase
ICT (Inner Circle Trader) weekly profile templates are analytical frameworks that categorize and describe typical patterns of price action observed during a trading week.
ICT Weekly Profiles
ICT Missing Weekly Profiles
Scanner
📒 Usage
The primary objective of the ICT Weekly Profiles indicator is to provide traders with a comprehensive and actionable overview of the Weekly Previous, Current, and Future Profile. This allows traders to interpret market structure, anticipate price behavior, and align their trading decisions with higher time-frame trends.
Load the indicator on the chart
Enable Scanner
See the Predicted Profiles list
Predicted Profiles represent all potential scenarios for the current week, generated by a profile detection algorithm.
By visualizing potential outcomes through Predicted Profiles, the ICT Weekly Profiles indicator provides traders with a strategic edge, allowing them to remain flexible, prepared, and aligned with the most probable market movements.
🚨 Alerts
The indicator does not provide any alerts!
🔹 Notes
ICT Weekly Profiles
pbs.twimg.com
ICT Missing Weekly Profiles
pbs.twimg.com
⚠️ Disclaimer
These tools are exclusively available on the TradingView platform.
Our charting tools are intended solely for informational and educational purposes and should not be regarded as financial, investment, or trading advice. They are not designed to predict market movements or offer specific recommendations. Users should be aware that past performance is not indicative of future results and should not rely on these tools for financial decisions. By using these charting tools, the purchaser agrees that the seller and creator hold no responsibility for any decisions made based on information provided by the tools. The purchaser assumes full responsibility and liability for any actions taken and their consequences, including potential financial losses or investment outcomes that may result from the use of these products.
By purchasing, the customer acknowledges and accepts that neither the seller nor the creator is liable for any undesired outcomes stemming from the development, sale, or use of these products. Additionally, the purchaser agrees to indemnify the seller from any liability. If invited through the Friends and Family Program, the purchaser understands that any provided discount code applies only to the initial purchase of Candela's subscription. The purchaser is responsible for canceling or requesting cancellation of their subscription if they choose not to continue at the full retail price. In the event the purchaser no longer wishes to use the products, they must unsubscribe from the membership service, if applicable.
We do not offer reimbursements, refunds, or chargebacks. Once these Terms are accepted at the time of purchase, no reimbursements, refunds, or chargebacks will be issued under any circumstances.
By continuing to use these charting tools, the user confirms their understanding and acceptance of these Terms as outlined in this disclaimer.

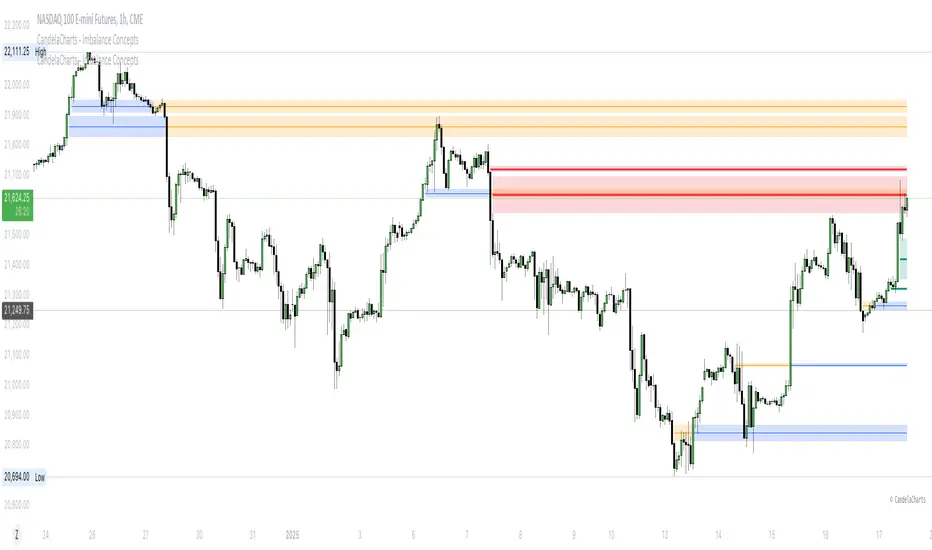
CandelaCharts - Imbalance Concepts 📝 Overview
Imbalance Concepts is an advanced toolkit rooted in ICT (Inner Circle Trader) principles, specifically designed to identify and highlight critical areas of support and resistance within financial markets. This toolkit focuses on detecting market imbalances that can indicate potential turning points or high-probability zones for price action.
The key components of the toolkit include:
Fair Value Gaps (FVG)
Inversion Fair Value Gaps (IFVG)
Balanced Price Range (BPR)
Volume Imbalances (VI)
Opening Gaps (OG)
The toolkit automatically detects these imbalances and visually marks them on charts, allowing traders to quickly identify key zones for analysis. This enables more informed decision-making, as these imbalances often signal the potential for major market shifts, reversals, or continuation patterns.
By integrating Imbalance Concepts, traders can focus on critical price areas that have a high likelihood of influencing future price action.
📦 Features
The Imbalance Concepts toolkit provides a robust set of features aimed at improving trading accuracy and decision-making. Key features include:
MTF
Mitigation
Consequent Encroachment
Threshold
Hide Overlap
Advanced Styling
⚙️ Settings
Show: Controls whether Imbalances are displayed on the chart.
Show Last: Sets the number of Imbalances you want to display.
Length: Determines the length of each Imbalance.
Mitigation: Highlights when an Imbalance has been touched, using a different color without marking it as invalid.
Timeframe: Specifies the timeframe used to detect Imbalances.
Threshold: Sets the minimum gap size required for Imbalance detection on the chart.
Show Mid-Line: Configures the midpoint line's width and style within the Imbalance. (Consequent Encroachment - CE)
Show Border: Defines the border width and line style of the Imbalance.
Hide Overlap: Removes overlapping Imbalances from view.
Extend: Extends the Imbalance length to the current candle.
Elongate: Fully extend the Imbalance length to the right side of the chart.
⚡️ Showcase
Fair Value Gaps (FVG)
Inversion Fair Value Gaps (IFVG)
Balanced Price Range (BPR)
Volume Imbalances (VI)
Opening Gaps (OG)
📒 Usage
The key components of trading imbalances include:
Step 1 – Identify Market Trend: Begin by determining the market trend for the asset, whether it is bullish or bearish.
Step 2 – Locate Premium and Discount Zones: In a bearish market, focus on identifying the premium Imbalance, while in a bullish market, look for the discount Imbalance.
Step 3 – Detect Liquidity Sweep: After identifying the trend, the next step is to spot a liquidity sweep, which often indicates a potential price reversal or continuation.
Step 4 – Detect Change In State of Delivery: Following the liquidity sweep, the next step is to recognize a CISD, which frequently serves as a confirmation of a potential price reversal.
Step 5 – Execute the Trade: In a bullish market, wait for the price to retrace and test the discount imbalance, aiming to balance the price movement before entering the trade.
NOTES:
You always short only on Premium, and long on Discount.
Fair Value Gaps (FVG)
Inversion Fair Value Gaps
Balanced Price Range
🚨 Alerts
The indicator provides the ability to set alerts for various significant market events related to its core features.
You can configure alerts for the following key events:
Fair Value Gaps Formation (+B/-B)
Inversion Fair Value Gaps Formation (+B/-B)
Balanced Price Range Formation (+B/-B)
Volume Imbalances Formation (+B/-B)
Opening Gaps Formation (+B/-B)
⚠️ Disclaimer
These tools are exclusively available on the TradingView platform.
Our charting tools are intended solely for informational and educational purposes and should not be regarded as financial, investment, or trading advice. They are not designed to predict market movements or offer specific recommendations. Users should be aware that past performance is not indicative of future results and should not rely on these tools for financial decisions. By using these charting tools, the purchaser agrees that the seller and creator hold no responsibility for any decisions made based on information provided by the tools. The purchaser assumes full responsibility and liability for any actions taken and their consequences, including potential financial losses or investment outcomes that may result from the use of these products.
By purchasing, the customer acknowledges and accepts that neither the seller nor the creator is liable for any undesired outcomes stemming from the development, sale, or use of these products. Additionally, the purchaser agrees to indemnify the seller from any liability. If invited through the Friends and Family Program, the purchaser understands that any provided discount code applies only to the initial purchase of Candela's subscription. The purchaser is responsible for canceling or requesting cancellation of their subscription if they choose not to continue at the full retail price. In the event the purchaser no longer wishes to use the products, they must unsubscribe from the membership service, if applicable.
We do not offer reimbursements, refunds, or chargebacks. Once these Terms are accepted at the time of purchase, no reimbursements, refunds, or chargebacks will be issued under any circumstances.
By continuing to use these charting tools, the user confirms their understanding and acceptance of these Terms as outlined in this disclaimer.
ICT Dealing RangeICT Dealing Range
This indicator identifies and plots ICT (Inner Circle Trader) Dealing Ranges - key institutional areas where smart money accumulates or distributes positions before significant moves.
What is a Dealing Range?
A Dealing Range is a significant price area where institutional traders accumulate or distribute their positions. These ranges form through a specific sequence of price movements that indicate institutional order flow:
Bullish Dealing Range Sequence:
1. Initial High (H)
2. Initial Low (L)
3. Higher High (HH)
4. Lower Low (LL)
5. Break above HH (confirmation)
Bearish Dealing Range Sequence:
1. Initial Low (L)
2. Initial High (H)
3. Lower Low (LL)
4. Higher High (HH)
5. Break below LL (confirmation)
My Trading Strategy
Entry Methods:
1. Range Extreme Retests:
- After range formation, wait for price to return to either extreme
- Long entries at range bottom with stops below
- Short entries at range top with stops above
2. Mid-Line Strategy:
- Use the mid-line as a pivot point for reversals
- Long entries on mid-line bounce with stops below
- Short entries on mid-line rejection with stops above
Stop Loss Placement:
- When entering at extremes: Place stops beyond the mid
- When entering at mid-line: Place stops beyond the opposing extreme
- Always respect the structure's boundaries
Take Profit Targets:
- Minimum 2:1 Risk-Reward ratio
- For extreme entries: Target the opposite extreme
- For mid-line entries: Target the nearest extreme
Risk Management
- Never enter without a clear invalidation point
- Maintain minimum 2:1 RR ratio
- Consider market structure and higher timeframe context
Indicator Features
- Auto-detection of dealing range patterns
- Color-coded boxes (green for bullish, red for bearish)
- Optional mid-line display
- Customizable colors and styles
- Adjustable pivot lookback periods
Notes
This tool is based on ICT concepts but should be used in conjunction with other forms of analysis. The dealing range provides a framework for understanding institutional order flow, but proper risk management and market context are essential for successful trading.
Remember: The best trades often come from clean retests of these ranges after their initial formation. Patience in waiting for proper setups is key to successful implementation.

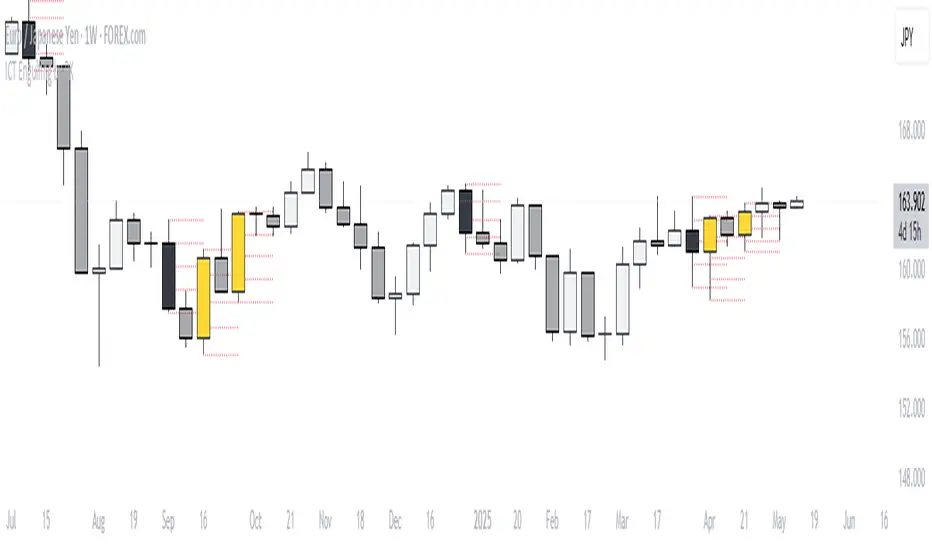
ICT Engulfing by RKName of Indicator: ICT Engulfing by RK
Short Description:
Highlight bullish and bearish engulfing candles based on the ICT (Inner Circle Trader) concept, with customizable options and colors.
Full Description:
The "ICT Engulfing by RK" indicator helps traders identify and visualize bullish and bearish engulfing candles using the ICT concept. It highlights key reversal points where price sweeps liquidity, aiding traders in spotting potential market turning points.
Features:
Bullish Engulfing Detection:
Identifies candles where the current candle sweeps the previous low, closes bullish, and above the previous open.
Optionally highlight these candles with a customizable color.
Bearish Engulfing Detection:
Identifies candles where the current candle sweeps the previous high, closes bearish, and below the previous open.
Optionally highlight these candles with a customizable color.
Customization Options:
Enable/disable detection of bullish and bearish engulfing candles.
Customize the colors for bullish and bearish engulfing candles.
How It Works:
Bullish Engulfing:
Detects a candle that:
Sweeps the previous candle's low.
Closes bullish and above the previous candle's open.
Bearish Engulfing:
Detects a candle that:
Sweeps the previous candle's high.
Closes bearish and below the previous candle's open.
This indicator is perfect for price action traders and ICT enthusiasts looking to integrate liquidity concepts into their trading strategy.
Notes:
Use this indicator in conjunction with other tools and market context for best results.
Test in a demo environment before applying to live markets.
Tags:
#ICT #Engulfing #PriceAction #TradingView #Reversals
Category:
Candle Patterns
Price Action
CandelaCharts - OHLC Macro Range Map 📝 Overview
Elevate your candlestick analysis with the OHLC Macro Range Map!
Unlike conventional OHLC charts, this advanced indicator weaves Inner Circle Trader (ICT) principles into its design, helping you decode accumulation, manipulation, and distribution patterns—candle by candle.
ICT traders recognize manipulation through wicks that extend against the candle’s closing direction—a deliberate move to mislead participants into unfavorable positions. These deceptive movements often hint at market manipulation phases. By decoding these subtle signals, traders can anticipate the distribution phase of a candle, where price action reveals potential liquidity targets, retracement zones, and key reversal points.
These levels offer valuable insights into order flow, revealing how price interacts with them and the sequence of movements within the market.
To enhance price analysis, the tool also monitors the average duration of manipulation and distribution phases. By blending historical timing patterns with key price levels associated with these phases, traders can conduct deeper analyses and fine-tune their strategies for better decision-making.
Although grounded in historical data, this indicator does not promise that past patterns will replicate in future market conditions. Instead, it provides a data-driven framework to identify moments when candles are likely to reverse after manipulation phases or retrace following completed distributions. This empowers traders to pinpoint potential market turning points with greater accuracy.
📦 Features
This tool offers a range of powerful features to enhance your trading analysis:
Average Range Accuracy : Simplify candlestick analysis with advanced lines and labels to pinpoint manipulation, distribution, and time pivots. Graph average ranges for your chosen timeframe to navigate market volatility and uncover key support and resistance zones.
Custom Timeframe Selection : Align your analysis with your trading strategy by choosing a timeframe that highlights the candle’s manipulation, distribution, and key timing.
Real-time Data Feed : Stay updated with live candlestick stats, with each new candle updating OHLC data and performing ongoing historical calculations, even on sub-minute timeframes.
Historical Mapping : Backtest past market scenarios with ease using the historical mapping feature. Traders can revisit and analyze previous data, refine strategies, and customize label displays for journaling flexibility.
User-Friendly Interface : Designed for advanced traders, the intuitive interface allows easy navigation and customization of display settings, offering a personalized experience for data-driven analysis.
⚙️ Settings
Macros: Sets the timeframe to which will be drawn.
Lookback: Controls period length in days.
Method: Sets the desired calculation algorithm.
History: Display Macro Range Map drawings for previous sessions.
Timezone: Dsiplay the data based on the selected timezone.
Opn: Style for Open line.
Man: Style for Manipulation line.
Dis: Style for Distribution line.
Time: Style for Timeline.
Labels: Controls the size and abbreviations.
Table Position: Manage the Macro Range Map table position
⚡️ Showcase
Here’s a visual showcase of the tool in action, highlighting its key features and capabilities:
Manipilation & Distribution
Time
📒 Usage
Here’s how you can use the OHLC Macro Range Map to enhance your analysis:
Add OHLC Macro Range Map to your Tradingview chart.
Select a timeframe and customize the styles to fit your preferences.
Watch as calculated manipulation, distribution, and delivery times align with your analysis.
Combine this data with other models and insights to strengthen your trading strategy.
Example 1
By following these steps, you'll unlock powerful insights to refine and elevate your trading strategies.
🔹 Notes
On Bullish candles:
Manipulation: Open - Low
Distribution: Open - High
On Bearish candles:
Manipulation: Open - High
Distribution: Open - Low
Available calculation methods:
Mean
Median
Price patterns on OHLC Macro Range Map:
Open - -Man - +Dis
Open - -Man - Open - +Dis
Open - -Man - +Man - +Dis
Open - -Man - +Man - -Dis
Open - +Man - -Dis
Open - +Man - Open - -Dis
Open - +Man - -Man - -Dis
Open - +Man - -Man - +Dis
🚨 Alerts
The indicator does not provide any alerts!
⚠️ Disclaimer
These tools are exclusively available on the TradingView platform.
Our charting tools are intended solely for informational and educational purposes and should not be regarded as financial, investment, or trading advice. They are not designed to predict market movements or offer specific recommendations. Users should be aware that past performance is not indicative of future results and should not rely on these tools for financial decisions. By using these charting tools, the purchaser agrees that the seller and creator hold no responsibility for any decisions made based on information provided by the tools. The purchaser assumes full responsibility and liability for any actions taken and their consequences, including potential financial losses or investment outcomes that may result from the use of these products.
By purchasing, the customer acknowledges and accepts that neither the seller nor the creator is liable for any undesired outcomes stemming from the development, sale, or use of these products. Additionally, the purchaser agrees to indemnify the seller from any liability. If invited through the Friends and Family Program, the purchaser understands that any provided discount code applies only to the initial purchase of Candela's subscription. The purchaser is responsible for canceling or requesting cancellation of their subscription if they choose not to continue at the full retail price. In the event the purchaser no longer wishes to use the products, they must unsubscribe from the membership service, if applicable.
We do not offer reimbursements, refunds, or chargebacks. Once these Terms are accepted at the time of purchase, no reimbursements, refunds, or chargebacks will be issued under any circumstances.
By continuing to use these charting tools, the user confirms their understanding and acceptance of these Terms as outlined in this disclaimer.

CandelaCharts - OHLC Session Range Map 📝 Overview
Master the art of candlestick analysis with the OHLC Session Range Map!
Enhance your TradingView strategies by incorporating this advanced tool for actionable insights. Far beyond standard OHLC visuals, this innovative indicator integrates Inner Circle Trader (ICT) concepts to analyze accumulation, manipulation, and distribution, one candle at a time.
ICT traders identify manipulation through wicks that extend opposite the candle’s close—a tactic designed to mislead market participants into taking positions in the "wrong" direction. These movements often signify potential manipulation phases. By interpreting these signals, traders can anticipate a candle’s distribution phase, where the price expands to higher or lower levels. This provides valuable insights into liquidity targets, retracement zones, and potential reversals.
These levels provide critical insights into order flow, illustrating how price interacts with them and the sequence in which it unfolds.
To refine price analysis further, the tool also tracks the average timing for the completion of manipulation and distribution phases. By combining historical timing patterns with price levels tied to these phases, traders can perform more in-depth analyses and enhance their market strategies.
While rooted in historical data, this indicator does not guarantee that past patterns will repeat in future market conditions. Instead, it offers a data-driven approach to identifying moments when candles are likely to reverse after manipulation phases or retrace following completed distributions, enabling traders to spot potential turning points with greater precision.
📦 Features
This tool offers a range of powerful features to enhance your trading analysis:
Average Range Accuracy : Simplify candlestick analysis with advanced lines and labels to pinpoint manipulation, distribution, and time pivots. Graph average ranges for your chosen timeframe to navigate market volatility and uncover key support and resistance zones.
Custom Timeframe Selection : Align your analysis with your trading strategy by choosing a timeframe that highlights the candle’s manipulation, distribution, and key timing.
Real-time Data Feed : Stay updated with live candlestick stats, with each new candle updating OHLC data and performing ongoing historical calculations, even on sub-minute timeframes.
Historical Mapping : Backtest past market scenarios with ease using the historical mapping feature. Traders can revisit and analyze previous data, refine strategies, and customize label displays for journaling flexibility.
User-Friendly Interface : Designed for advanced traders, the intuitive interface allows easy navigation and customization of display settings, offering a personalized experience for data-driven analysis.
⚙️ Settings
Sessions: Sets the timeframe to which will be drawn.
Lookback: Controls period length in days.
Method: Sets the desired calculation algorithm.
History: Display Session Range Map drawings for previous sessions.
Timezone: Dsiplay the data based on the selected timezone.
Opn: Style for Open line.
Man: Style for Manipulation line.
Dis: Style for Distribution line.
Time: Style for Timeline.
Labels: Controls the size and abbreviations.
Table Position: Manage the Session Range Map table position
⚡️ Showcase
Here’s a visual showcase of the tool in action, highlighting its key features and capabilities:
Manipilation & Distribution
Time
📒 Usage
Here’s how you can use the OHLC Session Range Map to enhance your analysis:
Add OHLC Session Range Map to your Tradingview chart.
Select a timeframe and customize the styles to fit your preferences.
Watch as calculated manipulation, distribution, and delivery times align with your analysis.
Combine this data with other models and insights to strengthen your trading strategy.
Example 1
Example 2
By following these steps, you'll unlock powerful insights to refine and elevate your trading strategies.
🔹 Notes
On Bullish candles:
Manipulation: Open - Low
Distribution: Open - High
On Bearish candles:
Manipulation: Open - High
Distribution: Open - Low
Available calculation methods:
Mean
Median
Price patterns on OHLC Session Range Map:
Open - -Man - +Dis
Open - -Man - Open - +Dis
Open - -Man - +Man - +Dis
Open - -Man - +Man - -Dis
Open - +Man - -Dis
Open - +Man - Open - -Dis
Open - +Man - -Man - -Dis
Open - +Man - -Man - +Dis
🚨 Alerts
The indicator does not provide any alerts!
⚠️ Disclaimer
These tools are exclusively available on the TradingView platform.
Our charting tools are intended solely for informational and educational purposes and should not be regarded as financial, investment, or trading advice. They are not designed to predict market movements or offer specific recommendations. Users should be aware that past performance is not indicative of future results and should not rely on these tools for financial decisions. By using these charting tools, the purchaser agrees that the seller and creator hold no responsibility for any decisions made based on information provided by the tools. The purchaser assumes full responsibility and liability for any actions taken and their consequences, including potential financial losses or investment outcomes that may result from the use of these products.
By purchasing, the customer acknowledges and accepts that neither the seller nor the creator is liable for any undesired outcomes stemming from the development, sale, or use of these products. Additionally, the purchaser agrees to indemnify the seller from any liability. If invited through the Friends and Family Program, the purchaser understands that any provided discount code applies only to the initial purchase of Candela's subscription. The purchaser is responsible for canceling or requesting cancellation of their subscription if they choose not to continue at the full retail price. In the event the purchaser no longer wishes to use the products, they must unsubscribe from the membership service, if applicable.
We do not offer reimbursements, refunds, or chargebacks. Once these Terms are accepted at the time of purchase, no reimbursements, refunds, or chargebacks will be issued under any circumstances.
By continuing to use these charting tools, the user confirms their understanding and acceptance of these Terms as outlined in this disclaimer.

CandelaCharts - OHLC Range Map 📝 Overview
Explore the intricate art of candlestick analysis with the OHLC Range Map!
Elevate your TradingView experience by integrating this dynamic tool into your trading strategies with actionable insights. This cutting-edge indicator transcends standard OHLC visuals, leveraging Inner Circle Trader (ICT) concepts to dissect accumulation, manipulation, and distribution on a candle-by-candle basis.
ICT traders recognize manipulation through the wick extending opposite the candle’s close. This movement often serves to mislead market participants into taking positions in the "wrong" direction, signaling potential manipulation legs. Analysts can use these insights to anticipate a candle’s distribution phase. During distribution, price extends to higher or lower levels, offering key clues for identifying liquidity draws, potential retracements, or reversals.
These levels offer valuable insights into order flow, highlighting how price interacts with them and the sequence of its delivery.
To enhance price mapping, the tool also charts the average timing for the completion of manipulation and distribution phases. This feature empowers traders to combine historical timing patterns with the price levels associated with manipulation and distribution for a deeper analysis.
Like all tools based on historical data, this indicator does not guarantee that past patterns will replicate in future market conditions. Designed with a data-driven edge, it highlights moments when candles are likely to reverse following manipulation phases or retrace after completing defined distributions, helping analysts spot potential turning points.
📦 Features
This tool offers a range of powerful features to enhance your trading analysis:
Average Range Accuracy : Simplify candlestick analysis with advanced lines and labels to pinpoint manipulation, distribution, and time pivots. Graph average ranges for your chosen timeframe to navigate market volatility and uncover key support and resistance zones.
Custom Timeframe Selection : Align your analysis with your trading strategy by choosing a timeframe that highlights the candle’s manipulation, distribution, and key timing.
Real-time Data Feed : Stay updated with live candlestick stats, with each new candle updating OHLC data and performing ongoing historical calculations, even on sub-minute timeframes.
Historical Mapping : Backtest past market scenarios with ease using the historical mapping feature. Traders can revisit and analyze previous data, refine strategies, and customize label displays for journaling flexibility.
User-Friendly Interface : Designed for advanced traders, the intuitive interface allows easy navigation and customization of display settings, offering a personalized experience for data-driven analysis.
⚙️ Settings
Timeframe: Sets the timeframe to which will be drawn.
Period: Controls period length in days.
Algorithm: Sets the desired calculation algorithm.
History: Display Range Map drawings for previous sessions.
Timezone: Dsiplay the data based on the selected timezone.
Use NY Midnight Open: Controls from where a Range Map will start detection.
Opn: Style for Open line.
Man: Style for Manipulation line.
Dis: Style for Distribution line.
Time: Style for Timeline.
Labels: Controls the size and abbreviations.
Line Position: Manage the Range Map line position
Table Position: Manage the Range Map table position
⚡️ Showcase
Here’s a visual showcase of the tool in action, highlighting its key features and capabilities:
Manipilation & Distribution
Time
📒 Usage
Here’s how you can use the OHLC Range Map to enhance your analysis:
Add OHLC Range Map to your Tradingview chart.
Select a timeframe and customize the styles to fit your preferences.
Watch as calculated manipulation, distribution, and delivery times align with your analysis.
Combine this data with other models and insights to strengthen your trading strategy.
Example 1
Example 2
By following these steps, you'll unlock powerful insights to refine and elevate your trading strategies.
🔹 Notes
On Bullish candles:
Manipulation: Open - Low
Distribution: Open - High
On Bearish candles:
Manipulation: Open - High
Distribution: Open - Low
Available calculation methods:
Mean
Median
Price patterns on OHLC Range Map:
Open - -Man - +Dis
Open - -Man - Open - +Dis
Open - -Man - +Man - +Dis
Open - -Man - +Man - -Dis
Open - +Man - -Dis
Open - +Man - Open - -Dis
Open - +Man - -Man - -Dis
Open - +Man - -Man - +Dis
🚨 Alerts
The indicator does not provide any alerts!
⚠️ Disclaimer
These tools are exclusively available on the TradingView platform.
Our charting tools are intended solely for informational and educational purposes and should not be regarded as financial, investment, or trading advice. They are not designed to predict market movements or offer specific recommendations. Users should be aware that past performance is not indicative of future results and should not rely on these tools for financial decisions. By using these charting tools, the purchaser agrees that the seller and creator hold no responsibility for any decisions made based on information provided by the tools. The purchaser assumes full responsibility and liability for any actions taken and their consequences, including potential financial losses or investment outcomes that may result from the use of these products.
By purchasing, the customer acknowledges and accepts that neither the seller nor the creator is liable for any undesired outcomes stemming from the development, sale, or use of these products. Additionally, the purchaser agrees to indemnify the seller from any liability. If invited through the Friends and Family Program, the purchaser understands that any provided discount code applies only to the initial purchase of Candela's subscription. The purchaser is responsible for canceling or requesting cancellation of their subscription if they choose not to continue at the full retail price. In the event the purchaser no longer wishes to use the products, they must unsubscribe from the membership service, if applicable.
We do not offer reimbursements, refunds, or chargebacks. Once these Terms are accepted at the time of purchase, no reimbursements, refunds, or chargebacks will be issued under any circumstances.
By continuing to use these charting tools, the user confirms their understanding and acceptance of these Terms as outlined in this disclaimer.

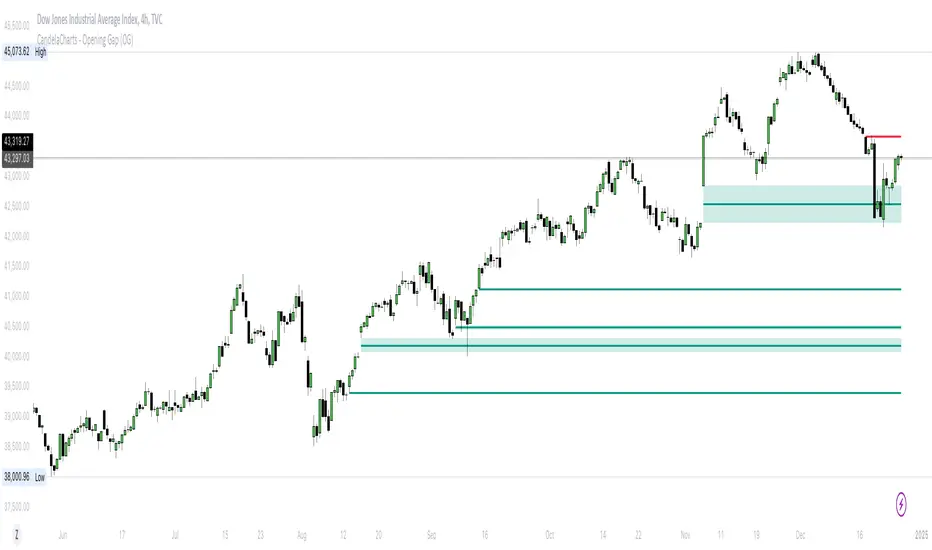
CandelaCharts - Opening Gap (OG) 📝 Overview
The ICT (Inner Circle Trader) Opening Gap represents the price difference between the previous trading session's closing price and the current session's opening price. This gap serves as a key indicator of market sentiment and can offer valuable clues about the market's potential direction throughout the trading day.
A bullish Opening Gap forms when the market opens higher than the previous session's close, signaling strong buying interest or positive sentiment heading into the new session
A bearish Opening Gap occurs when the market opens lower than the previous session's close, reflecting heightened selling pressure or negative sentiment among market participants
The Opening Gap is significant as it often establishes the market's tone for the trading session. Accurately interpreting this gap enables traders to make informed decisions about when to enter or exit positions. Serving as a gauge of market strength or weakness, the gap provides a clear signal of whether the market is likely to trend upward or downward during the day.
📦 Features
MTF
Mitigation
Consequent Encroachment
Threshold
Hide Overlap
Advanced Styling
⚙️ Settings
Show: Controls whether OGs are displayed on the chart.
Show Last: Sets the number of OGs you want to display.
Length: Determines the length of each OG.
Mitigation: Highlights when an OG has been touched, using a different color without marking it as invalid.
Timeframe: Specifies the timeframe used to detect OGs.
Threshold: Sets the minimum gap size required for OG detection on the chart.
Show Mid-Line: Configures the midpoint line's width and style within the OG. (Consequent Encroachment - CE)
Show Border: Defines the border width and line style of the OG.
Hide Overlap: Removes overlapping OGs from view.
Extend: Extends the OG length to the current candle.
Elongate: Fully extends the OG length to the right side of the chart.
⚡️ Showcase
Simple
Mitigated
Bordered
Consequent Encroachment
Extended
🚨 Alerts
This script provides alert options for all signals.
Bearish Signal
A bearish signal is triggered when the price opens lower than the previous session's close.
Bullish Signal
A bullish signal is triggered when the price opens higher than the previous session's close.
⚠️ Disclaimer
Trading involves significant risk, and many participants may incur losses. The content on this site is not intended as financial advice and should not be interpreted as such. Decisions to buy, sell, hold, or trade securities, commodities, or other financial instruments carry inherent risks and are best made with guidance from qualified financial professionals. Past performance is not indicative of future results.
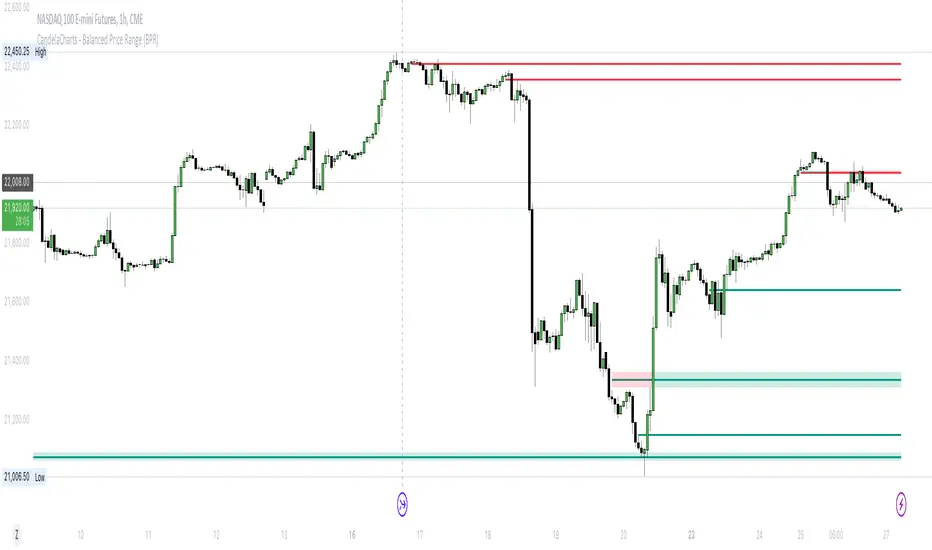
CandelaCharts - Balanced Price Range (BPR) 📝 Overview
ICT Balanced Price Range (BPR) is the area on the price chart where two opposite Fair Value Gaps overlap.
To identify a Balanced Price Range (BPR), mark a fair value gap (FVG) on the sell side of the price and another on the buy side. These FVGs should be directly opposite each other horizontally. The overlapping area between the two is the Balanced Price Range.
The significance of the ICT Balanced Price Range lies in its sensitivity to price movements. When the market approaches a BPR, it often triggers a rapid and notable price reaction.
This reaction occurs because the two opposing FVGs attract the attention of smart money traders—those with substantial capital capable of influencing market trends. As a key concept in the Inner Circle Trader (ICT) methodology, the BPR serves as an ideal entry point, frequently driving considerable market activity.
📦 Features
MTF
Mitigation
Consequent Encroachment (CE)
Threshold
Hide Overlap
Advanced Styling
⚙️ Settings
Show: Controls whether BPRs are displayed on the chart.
Show Last: Sets the number of BPRs you want to display.
Length: Determines the length of each BPR.
Mitigation: Highlights when an BPR has been touched, using a different color without marking it as invalid.
Timeframe: Specifies the timeframe used to detect BPRs.
Threshold: Sets the minimum gap size required for BPR detection on the chart.
Show Mid-Line: Configures the midpoint line's width and style within the BPR. (Consequent Encroachment - CE)
Show Border: Defines the border width and line style of the BPR.
Hide Overlap: Removes overlapping BPRs from view.
Extend: Extends the BPR length to the current candle.
Elongate: Fully extends the BPR length to the right side of the chart.
⚡️ Showcase
Simple
Mitigated
Bordered
Consequent Encroachment
Extended
🚨 Alerts
This script offers alert options for all signal types.
Bearish Signal
A bearish signal is generated when the price re-enters a bearish inversion zone and then reverses downward.
Bullish Signal
A bullish signal is generated when the price revisits a bullish inversion zone and then breaks upward through the top.
⚠️ Disclaimer
Trading involves significant risk, and many participants may incur losses. The content on this site is not intended as financial advice and should not be interpreted as such. Decisions to buy, sell, hold, or trade securities, commodities, or other financial instruments carry inherent risks and are best made with guidance from qualified financial professionals. Past performance is not indicative of future results.
ICT Macro Sessions by @zeusbottradingICT Macro Sessions Indicator
The ICT Macro Sessions Indicator is a powerful tool designed for traders who follow the ICT (Inner Circle Trader) methodology and want to optimize their trading during specific high-probability time intervals. This indicator highlights all the key macro sessions throughout the trading day in the GMT+8 (Hong Kong) time zone.
What Does the Indicator Do?
This indicator visually marks ICT Macro Sessions on your trading chart using background colors and optional labels. Each session corresponds to specific time intervals when institutional activity is most likely to drive price action. By focusing on these periods, traders can align their strategies with market volatility and liquidity, increasing their chances of success.
Highlighted Sessions
The indicator covers all major ICT Macro Sessions, each with a unique color for easy identification:
London Macro 1 (15:33–16:00 GMT+8):
- Marks the early London session, often characterized by strong directional moves.
London Macro 2 (17:03–17:30 GMT+8):
- Captures the mid-London session, where price frequently reacts to liquidity levels.
New York AM Macro 1 (22:50–23:10 GMT+8):
- Highlights the start of the New York session, a prime time for price reversals or continuations.
New York AM Macro 2 (23:50–00:10 GMT+8):
- Focuses on late-morning New York activity, often aligning with key news releases.
New York Lunch Macro (00:50–01:10 GMT+8):
- Covers the lunch period in New York, where price may consolidate or set up for afternoon moves.
New York PM Macro 1 (02:10–02:40 GMT+8):
- Tracks post-lunch activity in New York, often featuring renewed volatility.
New York PM Macro 2 (04:15–04:45 GMT+8):
- Captures late-session moves as institutional traders finalize their positions.
Features of the Indicator
Fixed Time: The indicator is pre-configured for GMT+8 but it will adapt automatically to your timezone. No need to change anything in the code.
Background Highlighting: Each session is visually marked with a unique background color for quick recognition.
Optional Labels: Traders can enable or disable labels for each session, providing flexibility in how information is displayed.
Session Toggles: You can choose which sessions to display based on your trading preferences and strategy.
Intraday Timeframes: The indicator is optimized for intraday charts with timeframes of 45 minutes or less. You can change it to anything you like.
Why Use This Indicator?
The ICT Macro Sessions Indicator helps traders focus on the most critical times of the trading day when institutional activity is at its peak. These periods often coincide with significant price movements, making them ideal for scalping, day trading, or even swing trading setups. By visually highlighting these sessions, the indicator eliminates guesswork and allows traders to plan their trades with precision.

Silver Bullet ICT Strategy [TradingFinder] 10-11 AM NY Time +FVG🔵 Introduction
The ICT Silver Bullet trading strategy is a precise, time-based algorithmic approach that relies on Fair Value Gaps and Liquidity to identify high-probability trade setups. The strategy primarily focuses on the New York AM Session from 10:00 AM to 11:00 AM, leveraging heightened market activity within this critical window to capture short-term trading opportunities.
As an intraday strategy, it is most effective on lower timeframes, with ICT recommending a 15-minute chart or lower. While experienced traders often utilize 1-minute to 5-minute charts, beginners may find the 1-minute timeframe more manageable for applying this strategy.
This approach specifically targets quick trades, designed to take advantage of market movements within tight one-hour windows. By narrowing its focus, the Silver Bullet offers a streamlined and efficient method for traders to capitalize on liquidity shifts and price imbalances with precision.
In the fast-paced world of forex trading, the ability to identify market manipulation and false price movements is crucial for traders aiming to stay ahead of the curve. The Silver Bullet Indicator simplifies this process by integrating ICT principles such as liquidity traps, Order Blocks, and Fair Value Gaps (FVG).
These concepts form the foundation of a tool designed to mimic the strategies of institutional players, empowering traders to align their trades with the "smart money." By transforming complex market dynamics into actionable insights, the Silver Bullet Indicator provides a powerful framework for short-term trading success
Silver Bullet Bullish Setup :
Silver Bullet Bearish Setup :
🔵 How to Use
The Silver Bullet Indicator is a specialized tool that operates within the critical time windows of 9:00-10:00 and 10:00-11:00 in the forex market. Its design incorporates key principles from ICT (Inner Circle Trader) methodology, focusing on concepts such as liquidity traps, CISD Levels, Order Blocks, and Fair Value Gaps (FVG) to provide precise and actionable trade setups.
🟣 Bullish Setup
In a bullish setup, the indicator starts by marking the high and low of the session, serving as critical reference points for liquidity. A typical sequence involves a liquidity grab below the low, where the price manipulates retail traders into selling positions by breaching a key support level.
This movement is often orchestrated by smart money to accumulate buy orders. Following this liquidity grab, a market structure shift (MSS) occurs, signaled by the price breaking the CISD Level—a confirmation of bullish intent. The indicator then highlights an Order Block near the CISD Level, representing the zone where institutional buying is concentrated.
Additionally, it identifies a Fair Value Gap, which acts as a high-probability area for price retracement and trade entry. Traders can confidently take long positions when the price revisits these zones, targeting the next significant liquidity pool or resistance level.
Bullish Setup in CAPITALCOM:US100 :
🟣 Bearish Setup
Conversely, in a bearish setup, the price manipulates liquidity by creating a false breakout above the high of the session. This move entices retail traders into long positions, allowing institutional players to enter sell orders.
Once the price reverses direction and breaches the CISD Level to the downside, a change of character (CHOCH) becomes evident, confirming a bearish market structure. The indicator highlights an Order Block near this level, indicating the origin of the institutional sell orders, along with an associated FVG, which represents an imbalance zone likely to be revisited before the price continues downward.
By entering short positions when the price retraces to these levels, traders align their strategies with the anticipated continuation of bearish momentum, targeting nearby liquidity voids or support zones.
Bearish Setup in OANDA:XAUUSD :
🔵 Settings
Refine Order Block : Enables finer adjustments to Order Block levels for more accurate price responses.
Mitigation Level OB : Allows users to set specific reaction points within an Order Block, including: Proximal: Closest level to the current price. 50% OB: Midpoint of the Order Block. Distal: Farthest level from the current price.
FVG Filter : The Judas Swing indicator includes a filter for Fair Value Gap (FVG), allowing different filtering based on FVG width: FVG Filter Type: Can be set to "Very Aggressive," "Aggressive," "Defensive," or "Very Defensive." Higher defensiveness narrows the FVG width, focusing on narrower gaps.
Mitigation Level FVG : Like the Order Block, you can set price reaction levels for FVG with options such as Proximal, 50% OB, and Distal.
CISD : The Bar Back Check option enables traders to specify the number of past candles checked for identifying the CISD Level, enhancing CISD Level accuracy on the chart.
🔵 Conclusion
The Silver Bullet Indicator is a cutting-edge tool designed specifically for forex traders who aim to leverage market dynamics during critical liquidity windows. By focusing on the highly active 9:00-10:00 and 10:00-11:00 timeframes, the indicator simplifies complex market concepts such as liquidity traps, Order Blocks, Fair Value Gaps (FVG), and CISD Levels, transforming them into actionable insights.
What sets the Silver Bullet Indicator apart is its precision in detecting false breakouts and market structure shifts (MSS), enabling traders to align their strategies with institutional activity. The visual clarity of its signals, including color-coded zones and directional arrows, ensures that both novice and experienced traders can easily interpret and apply its findings in real-time.
By integrating ICT principles, the indicator empowers traders to identify high-probability entry and exit points, minimize risk, and optimize trade execution. Whether you are capturing short-term price movements or navigating complex market conditions, the Silver Bullet Indicator offers a robust framework to enhance your trading performance.
Ultimately, this tool is more than just an indicator; it is a strategic ally for traders who seek to decode the movements of smart money and capitalize on institutional strategies. With the Silver Bullet Indicator, traders can approach the market with greater confidence, precision, and profitability.

ICT Setup 02 [TradingFinder] Breaker Blocks + Reversal Candles🔵 Introduction
The "Breaker Block" concept, widely utilized in ICT (Inner Circle Trader) technical analysis, is a crucial tool for identifying reversal points and significant market shifts. Originating from the "Order Block" concept, Breaker Blocks help traders pinpoint support and resistance levels. These blocks are essential for understanding market trends and recognizing optimal entry and exit points.
A Breaker Block is essentially a failed Order Block that changes its role when price action breaks through it. When an Order Block fails to hold as a support or resistance level, it reverses its function, becoming a Breaker Block.
There are two primary types : Bullish Breaker Blocks and Bearish Breaker Blocks. These Breaker Blocks align with the prevailing market trend and indicate potential entry points after a liquidity sweep or a shift in market structure.
Understanding and applying the Breaker Block strategy enables traders to capitalize on the behavior of institutional investors, enhancing their trading outcomes.
Bullish Setup :
Bearish Setup :
🔵 How to Use
The ICT Setup 02 indicator designed to automate the identification of Bullish and Bearish Breaker Blocks. This tool enables traders to easily spot these blocks on a chart and utilize them for entering or exiting trades. Below is a breakdown of how to use this indicator in both bullish and bearish setups.
🟣 Bullish Breaker Block Setup
A Bullish Breaker Block setup is identified in an uptrend, where it serves as a potential entry point. This setup occurs when a Bearish Order Block fails and the price moves above the high of that Order Block. In this scenario, the previously bearish Order Block turns into a Bullish Breaker Block, which now acts as a support level for the price.
To trade a Bullish Breaker Block, wait for the price to retest this newly formed support level. Confirmation of the uptrend can be achieved by analyzing lower time frames for further market structure shifts or other bullish indicators.
A successful retest of the Bullish Breaker Block provides a high-probability entry point for a long trade, as it signals institutional support. Traders often place their stop-loss below the low of the Breaker Block zone to minimize risk.
🟣 Bearish Breaker Block Setup
A Bearish Breaker Block setup, conversely, is used in a downtrend to identify potential sell opportunities. This setup forms when a Bullish Order Block fails, and the price moves below the low of that Order Block.
Once this Order Block is broken, it reverses its role and becomes a Bearish Breaker Block, providing resistance to the price as it pushes downward. For a Bearish Breaker Block trade, wait for the price to retest this resistance level.
A confirmation of the downtrend, such as a market structure shift on a lower time frame or additional bearish signals, strengthens the setup. The Bearish Breaker Block retest provides an opportunity to enter a short position, with a stop-loss placed just above the high of the Breaker Block zone.
🔵 Settings
Pivot Period : This setting controls the look-back period used to identify pivot points that contribute to the detection of Order Blocks. A higher period captures longer-term pivots, while a lower period focuses on more recent price action. Adjusting this parameter allows traders to fine-tune the indicator to match their trading time frame.
Breaker Block Validity Period : This setting defines how long a Breaker Block remains valid based on the number of bars elapsed since its formation. Increasing the validity period keeps Breaker Blocks active for a longer duration, which can be useful for higher time frame analysis.
Mitigation Level BB : This option lets traders choose the level of the Order Block at which the price is expected to react. Options like "Proximal," "50% OB," and "Distal" adjust the zone where a reaction may occur, offering flexibility in setting up the entry and stop-loss levels.
Breaker Block Refinement : The refinement option refines the Breaker Block zone to display a more precise range for aggressive or defensive trading approaches. The "Aggressive" mode provides a tighter range for risk-tolerant traders, while the "Defensive" mode expands the zone for those with a more conservative approach.
🔵 Conclusion
The Breaker Block indicator provides traders with a sophisticated tool for identifying key reversal zones in the market. By leveraging Breaker Blocks, traders can gain insights into institutional order flow and predict critical support and resistance levels.
Using Breaker Blocks in conjunction with other ICT concepts, like Fair Value Gaps or liquidity sweeps, enhances the reliability of trading signals. This indicator empowers traders to make informed decisions, aligning their trades with institutional moves in the market.
As with any trading strategy, it is crucial to incorporate proper risk management, using stop-losses and position sizing to minimize potential losses. The Breaker Block strategy, when applied with discipline and thorough analysis, serves as a powerful addition to any trader’s toolkit.

Implied Fair Value Gap (IFVG) ICT [TradingFinder] Hidden FVG OTE🔵 Introduction
The Implied Fair Value Gap (IFVG) is distinctive due to its unique three-candlestick formation, which differentiates it from conventional Fair Value Gaps.
Implied fair value represents an estimated worth of an asset—often a business or its goodwill—based on the price likely to be received in a structured transaction between market participants at a specific point in time.
In the ever-evolving world of technical analysis, pinpointing price reversal points and market anomalies can significantly enhance trading strategies and decision-making for traders and investors. Among the advanced concepts gaining traction in this field is the Implied Fair Value Gap (IFVG), introduced by the renowned analyst Inner Circle Trader (ICT).
This tool has proven to be an effective method for identifying hidden supply and demand zones in financial markets, offering a unique edge to traders looking for high-probability setups.
Unlike traditional gaps that are visible on price charts, IFVG is a hidden gap that doesn’t appear explicitly on the chart and thus requires specialized technical analysis tools for accurate identification.
This hidden gap can signal potential price reversals and offers traders insight into high-liquidity areas where price is likely to react. This article will guide you through using the ICT Implied Fair Value Gap Indicator effectively, covering its settings, usage strategies, and key features to help you make informed decisions in the market.
🟣 Bullish Implied FVG
🟣 Bearish Implied FVG
🔵 How to Use
The IFVG indicator is designed to assist traders in recognizing hidden support and resistance zones by identifying Bullish and Bearish IFVG patterns. With this tool, traders can make better-informed decisions about suitable entry and exit points for their trades based on these patterns.
🟣 Bullish Implied Fair Value Gap
This pattern occurs in an uptrend when a large bullish candlestick forms, with the wicks of the previous and following candles overlapping the body of the central candlestick.
This overlap creates a demand zone or a hidden support level, which can act as an ideal entry point for buy trades. Often, when the price returns to this area, it is likely to resume its upward trend, presenting a profitable buying opportunity.
🟣 Bearish Implied Fair Value Gap
This pattern is similar but forms in downtrends. Here, a large bearish candlestick appears on the chart, with the wicks of adjacent candles overlapping its body. This overlap defines a supply zone or a hidden resistance level and serves as a signal for potential sell trades.
When the price returns to this zone, it often continues its downward trend, providing an optimal point for entering sell trades.
The IFVG indicator also includes various filters that traders can use to refine their analysis based on market conditions. These filters, including Very Aggressive, Aggressive, Defensive, and Very Defensive, allow users to customize the IFVG zones' width, offering flexibility according to the trader’s risk tolerance and trading style.
🟣 Example Trading Scenarios
Suppose you’re in a strong uptrend and the IFVG indicator identifies a Bullish IFVG zone. In this scenario, you could consider entering a buy trade when the price retraces to this zone, expecting the uptrend to resume. Conversely, in a downtrend, a Bearish IFVG zone can signal a favorable entry point for short trades when the price revisits this area.
🔵 Settings
Implied Block Validity Period: This parameter specifies the validity period of each identified block, taking into account the number of bars that have passed since its formation. Proper adjustment of this period helps traders focus only on relevant zones, increasing the accuracy of the analysis.
Mitigation Level OB : This option defines the mitigation level for supply and demand blocks (Order Blocks), with settings including Proximal, 50% OB, and Distal.
Depending on the selected level, the indicator will focus on closer, mid-range, or farther points for block identification, allowing traders to adjust for the level of precision required.
Implied Filter : Activating this filter allows traders to apply conditions based on the width of the IFVG zones. With options like Very Aggressive and Very Defensive, traders can control the width of IFVG zones to suit their risk management strategy—whether they prefer high-risk setups or low-risk setups.
Display and Color Settings : This section enables users to customize the appearance of the IFVG zones on their charts. Traders can set different colors for Bullish and Bearish zones, allowing for easier distinction and improved visualization.
Alert Settings : One of the standout features of the IFVG indicator is the alert system. By setting up alerts, users can be notified whenever the price approaches a demand or supply zone.
Alerts can be customized to trigger Once Per Bar (one alert per bar) or Per Bar Close (alert at the close of each bar), ensuring that traders stay updated on critical price movements without needing to monitor the chart continuously.
🔵 Conclusion
The ICT Implied Fair Value Gap (IFVG) indicator is a powerful and sophisticated tool in technical analysis, allowing professional traders to identify hidden supply and demand zones and use them as entry and exit points for buy and sell trades.
This indicator’s automatic detection of IFVG zones helps traders uncover hidden trading opportunities that can enhance their analysis.
While the IFVG indicator offers numerous advantages, it is important to use it in conjunction with other technical analysis tools and sound risk management practices.
IFVG alone does not guarantee profitability in trading; it works best when combined with other indicators such as volume analysis and trend-following indicators for a comprehensive trading strategy.

Immediate Rebalance ICT [TradingFinder] No Imbalances - MTF Gaps🔵 Introduction
The concept of "Immediate Rebalance" in technical analysis is a powerful and advanced strategy within the ICT (Inner Circle Trader) framework, widely used to identify key market levels.
Unlike the "Fair Value Gap," which leaves a price gap requiring a retracement for a fill, an Immediate Rebalance fills the gap immediately, representing an instant balance that strengthens the prevailing market trend. This structure allows traders to quickly spot critical price zones, capitalizing on strong trend continuations without the need for price retracement.
The "Immediate Rebalance ICT" indicator leverages this concept, providing traders with automated identification of critical supply and demand zones, order blocks, liquidity voids, and key buy-side and sell-side liquidity levels.
Through features like crucial liquidity points and immediate rebalancing areas, this tool enables traders to perform precise real-time market analysis and seize profitable opportunities.
🔵 How to Use
The Immediate Rebalance indicator assists traders in identifying reliable trading signals by detecting and analyzing Immediate Rebalance zones. By focusing on supply and demand areas, the indicator pinpoints optimal entry and exit positions.
Here’s how to use the indicator in both bearish (Supply Immediate Rebalance) and bullish (Demand Immediate Rebalance) structures :
🟣 Bullish Structure (Demand Immediate Rebalance)
In a bullish scenario, the indicator detects a Demand Immediate Rebalance formed by two consecutive bullish candles with overlapping wicks. This structure signifies an immediate demand zone, where price instantly balances within the zone, reducing the likelihood of a revisit and indicating potential upside momentum.
Zone Identification : Look for two consecutive bullish candles with overlapping wicks, forming a demand zone. This structure, due to its rapid balance, usually does not require a revisit and supports further upward movement.
Entry and Exit Levels : If price revisits this zone, percentage markers, particularly 50% and 75%, act as supportive levels, creating ideal entry points for long positions.
Example : In the second image, an example of a Demand Immediate Rebalance is shown, where overlapping bullish candle shadows indicate immediate balance, supporting the continuation of the bullish trend.
🟣 Bearish Structure (Supply Immediate Rebalance)
In a bearish setup, the indicator identifies a Supply Immediate Rebalance when two consecutive bearish candles with overlapping wicks appear. This formation signals an immediate supply zone, suggesting a high probability of trend continuation to the downside, with minimal expectation for price to retrace back to this area.
Zone Identificatio n: Look for two consecutive bearish candles with overlapping shadows. This structure forms a supply area where price is expected to continue its downtrend without revisiting the zone.
Entry and Exit Level s: Should price revisit this zone, percentage-based levels (e.g., 50% and 75%) serve as potential resistance points, optimizing entry for short positions, especially if the downtrend is expected to persist.
Example : The attached chart illustrates a Supply Immediate Rebalance, where overlapping candle shadows define this area, reassuring traders of a continued downward trend with a low likelihood of price returning to this zone.
🔵 Settings
ImmR Filter : This filter allows users to adjust the detection of Immediate Rebalance zones in four modes, from "Very Aggressive" to "Very Defensive," based on zone width. The chosen mode controls the sensitivity of Immediate Rebalance detection, allowing users to fine-tune the indicator to their trading style.
Multi Time Frame : Enabling this option allows users to set the indicator to a specific timeframe (1 minute, 5 minutes, 15 minutes, 30 minutes, 1 hour, 4 hours, daily, weekly, or monthly), broadening the perspective for identifying Immediate Rebalance zones across multiple timeframes.
🔵 Conclusion
The Immediate Rebalance indicator, based on rapid balancing zones within supply and demand areas, serves as a powerful tool for market analysis and improving trade decision-making.
By accurately identifying zones where price achieves instant balance without gaps, the indicator highlights areas likely to support strong trend continuations, exempt from common retracements.
The indicator’s use of percentage levels enables traders to pinpoint optimal entry and exit points more effectively, with levels like 50% and 75% acting as support within demand zones and resistance within supply zones. This empowers traders to ride strong trends without the worry of abrupt reversals.
Overall, the Immediate Rebalance is a reliable tool for both professional and beginner traders seeking precise methods to recognize supply and demand zones, capitalizing on consistent trends.
By choosing appropriate settings and focusing on the zones highlighted by this indicator, traders can enter trades with greater confidence and improve their risk management.

Macros ICT KillZones [TradingFinder] Times & Price Trading Setup🔵 Introduction
ICT Macros, developed by Michael Huddleston, also known as ICT (Inner Circle Trader), is a powerful trading tool designed to help traders identify the best trading opportunities during key time intervals like the London and New York trading sessions.
For traders aiming to capitalize on market volatility, liquidity shifts, and Fair Value Gaps (FVG), understanding and using these critical time zones can significantly improve trading outcomes.
In today’s highly competitive financial markets, identifying the moments when the market is seeking buy-side or sell-side liquidity, or filling price imbalances, is essential for maximizing profitability.
The ICT Macros indicator is built on the renowned ICT time and price theory, which enables traders to track and leverage key market dynamics such as breaks of highs and lows, imbalances, and liquidity hunts.
This indicator automatically detects crucial market times and optimizes strategies for traders by highlighting the specific moments when price movements are most likely to occur. A standout feature of ICT Macros is its automatic adjustment for Daylight Saving Time (DST), ensuring that traders remain synced with the correct session times.
This means you can rely on accurate market timing without the need for manual updates, allowing you to focus on capturing profitable trades during critical timeframes.
🔵 How to Use
The ICT Macros indicator helps you capitalize on trading opportunities during key market moments, particularly when the market is breaking highs or lows, filling Fair Value Gaps (FVG), or addressing imbalances. This indicator is particularly beneficial for traders who seek to identify liquidity, market volatility, and price imbalances.
🟣 Sessions
London Sessions
London Macro 1 :
UTC Time : 06:33 to 07:00
New York Time : 02:33 to 03:00
London Macro 2 :
UTC Time : 08:03 to 08:30
New York Time : 04:03 to 04:30
New York Sessions
New York Macro AM 1 :
UTC Time : 12:50 to 13:10
New York Time : 08:50 to 09:10
New York Macro AM 2 :
UTC Time : 13:50 to 14:10
New York Time : 09:50 to 10:10
New York Macro AM 3 :
UTC Time : 14:50 to 15:10
New York Time : 10:50 to 11:10
New York Lunch Macro :
UTC Time : 15:50 to 16:10
New York Time : 11:50 to 12:10
New York PM Macro :
UTC Time : 17:10 to 17:40
New York Time : 13:10 to 13:40
New York Last Hour Macro :
UTC Time : 19:15 to 19:45
New York Time : 15:15 to 15:45
These time intervals adjust automatically based on Daylight Saving Time (DST), helping traders to enter or exit trades during key market moments when price volatility is high.
Below are the main applications of this tool and how to incorporate it into your trading strategies :
🟣 Combining ICT Macros with Trading Strategies
The ICT Macros indicator can easily be used in conjunction with various trading strategies. Two well-known strategies that can be combined with this indicator include:
ICT 2022 Trading Model : This model is designed based on identifying market liquidity, structural price changes, and Fair Value Gaps (FVG). By using ICT Macros, you can identify the key time intervals when the market is seeking liquidity, filling imbalances, or breaking through important highs and lows, allowing you to enter or exit trades at the right moment.
Silver Bullet Strategy : This strategy, which is built around liquidity hunting and rapid price movements, can work more accurately with the help of ICT Macros. The indicator pinpoints precise liquidity times, helping traders take advantage of market shifts caused by filling Fair Value Gaps or correcting imbalances.
🟣 Capitalizing on Price Volatility During Key Times
Large market algorithms often seek liquidity or fill Fair Value Gaps (FVG) during the intervals marked by ICT Macros. These periods are when price volatility increases, and traders can use these moments to enter or exit trades.
For example, if sell-side liquidity is drained and the market fills an imbalance, the price might move toward buy-side liquidity. By identifying these moments, which may also involve breaking a previous high or low, you can leverage rapid market fluctuations to your advantage.
🟣 Identifying Liquidity and Price Imbalances
One of the important uses of ICT Macros is identifying points where the market is seeking liquidity and correcting imbalances. You can determine high or low liquidity levels in the market before each ICT Macro, as well as Fair Value Gaps (FVG) and price imbalances that need to be filled, using them to adjust your trading strategy. This capability allows you to manage trades based on liquidity shifts or imbalance corrections without needing a bias toward a specific direction.
🔵 Settings
The ICT Macros indicator offers various customization options, allowing users to tailor it to their specific needs. Below are the main settings:
Time Zone Mode : You can select one of the following options to define how time is displayed:
UTC : For traders who need to work with Universal Time.
Session Local Time : The local time corresponding to the London or New York markets.
Your Time Zone : You can specify your own time zone (e.g., "UTC-4:00").
Your Time Zone : If you choose "Your Time Zone," you can set your specific time zone. By default, this is set to UTC-4:00.
Show Range Time : This option allows you to display the time range of each session on the chart. If enabled, the exact start and end times of each interval are shown.
Show or Hide Time Ranges : Toggle on/off for visual clarity depending on user preference.
Custom Colors : Set distinct colors for each session, allowing users to personalize their chart based on their trading style.These settings allow you to adjust the key time intervals of each trading session to your preference and customize the time format according to your own needs.
🔵 Conclusion
The ICT Macros indicator is a powerful tool for traders, helping them to identify key time intervals where the market seeks liquidity or fills Fair Value Gaps (FVG), corrects imbalances, and breaks highs or lows. This tool is especially valuable for traders using liquidity-based strategies such as ICT 2022 or Silver Bullet.
One of the key features of this indicator is its support for Daylight Saving Time (DST), ensuring you are always in sync with the correct trading session timings without manual adjustments. This is particularly beneficial for traders operating across different time zones.
With ICT Macros, you can capitalize on crucial market opportunities during sensitive times, take advantage of imbalances, and enhance your trading strategies based on market volatility, liquidity shifts, and Fair Value Gaps.

ICT Indicator with Paper TradingThe strategy implemented in the provided Pine Script is based on **ICT (Inner Circle Trader)** concepts, particularly focusing on **order blocks** to identify key levels for potential reversals or continuations in the market. Below is a detailed description of the strategy:
### 1. **Order Block Concept**
- **Order blocks** are price levels where large institutional orders accumulate, often leading to a reversal or continuation of price movement.
- In this strategy, **order blocks** are identified when:
- The high of the current bar crosses above the high of the previous bar (for bullish order blocks).
- The low of the current bar crosses below the low of the previous bar (for bearish order blocks).
### 2. **Buy and Sell Signal Generation**
The core of the strategy revolves around identifying the **breakout** of order blocks, which is interpreted as a signal to either enter or exit trades:
- **Buy Signal**:
- Generated when the closing price crosses **above** the last identified bullish order block (i.e., the highest point during the last upward crossover of highs).
- This signals a potential upward trend, and the strategy enters a long position.
- **Sell Signal**:
- Generated when the closing price crosses **below** the last identified bearish order block (i.e., the lowest point during the last downward crossover of lows).
- This signals a potential downward trend, and the strategy exits any open long positions.
### 3. **Strategy Execution**
The strategy is executed using the `strategy.entry()` and `strategy.close()` functions:
- **Enter Long Positions**: When a buy signal is generated, the strategy opens a long position (buying).
- **Exit Positions**: When a sell signal is generated, the strategy closes the long position.
### 4. **Visual Indicators on the Chart**
To make the strategy easier to follow visually, buy and sell signals are marked directly on the chart:
- **Buy signals** are indicated with a green upward-facing triangle above the bar where the signal occurred.
- **Sell signals** are indicated with a red downward-facing triangle below the bar where the signal occurred.
### 5. **Key Elements of the Strategy**
- **Trend Continuation and Reversals**: This strategy is attempting to capture trends based on the breakout of important price levels (order blocks). When the price breaks above or below a significant order block, it is expected that the market will continue in that direction.
- **Order Block Strength**: Order blocks are considered strong areas where price action could reverse or accelerate, based on how institutional investors place large orders.
### 6. **Paper Trading**
This script uses **paper trading** to simulate trades without actual money being involved. This allows users to backtest the strategy, seeing how it would have performed in historical market conditions.
### 7. **Basic Strategy Flow**
1. **Order Block Identification**: The script constantly monitors price movements to detect bullish and bearish order blocks.
2. **Buy Signal**: If the closing price crosses above the last order block high, the strategy interprets it as a sign of bullish momentum and enters a long position.
3. **Sell Signal**: If the closing price crosses below the last order block low, it signals a bearish momentum, and the strategy closes the long position.
4. **Visual Representation**: Buy and sell signals are displayed on the chart for easy identification.
### **Advantages of the Strategy:**
- **Simple and Clear Rules**: The strategy is based on clearly defined rules for identifying order blocks and trade signals.
- **Effective for Trend Following**: By focusing on breakouts of order blocks, this strategy attempts to capture strong trends in the market.
- **Visual Aids**: The plot of buy/sell signals helps traders to quickly see where trades would have been placed.
### **Limitations:**
- **No Shorting**: This strategy only enters long positions (buying). It does not account for shorting opportunities.
- **No Risk Management**: There are no built-in stop losses, trailing stops, or profit targets, which could expose the strategy to large losses during adverse market conditions.
- **Whipsaws in Range Markets**: The strategy could produce false signals in sideways or choppy markets, where breakouts are short-lived and prices quickly reverse.
### **Overall Strategy Objective:**
The goal of the strategy is to enter into long positions when the price breaks above a significant order block, and exit when it breaks below. The strategy is designed for trend-following, with the assumption that price will continue in the direction of the breakout.
Let me know if you'd like to enhance or modify this strategy further!
